Flag evaluations
Read time: 2 minutes
Last edited: Feb 05, 2025
Overview
This topic explains how to use the flag evaluations graph to observe flag evaluations over time. The flag evaluations graph gives your engineering and product teams insight into how many times different contexts are receiving each variation of a flag over time, as well as any changes to the flag that could have affected how many times each flag was evaluated.
View flag evaluations
To view a flag's evaluations graph:
- Navigate to the Flags list.
- Click the name of the flag you want to view evaluations over time for. The flag's Targeting tab appears.
- Click Evaluations to expand the section.
The flag evaluations graph displays flag evaluations over time. Hover on a specific date to view the number of flag evaluations and any changes you made to the flag on that date:
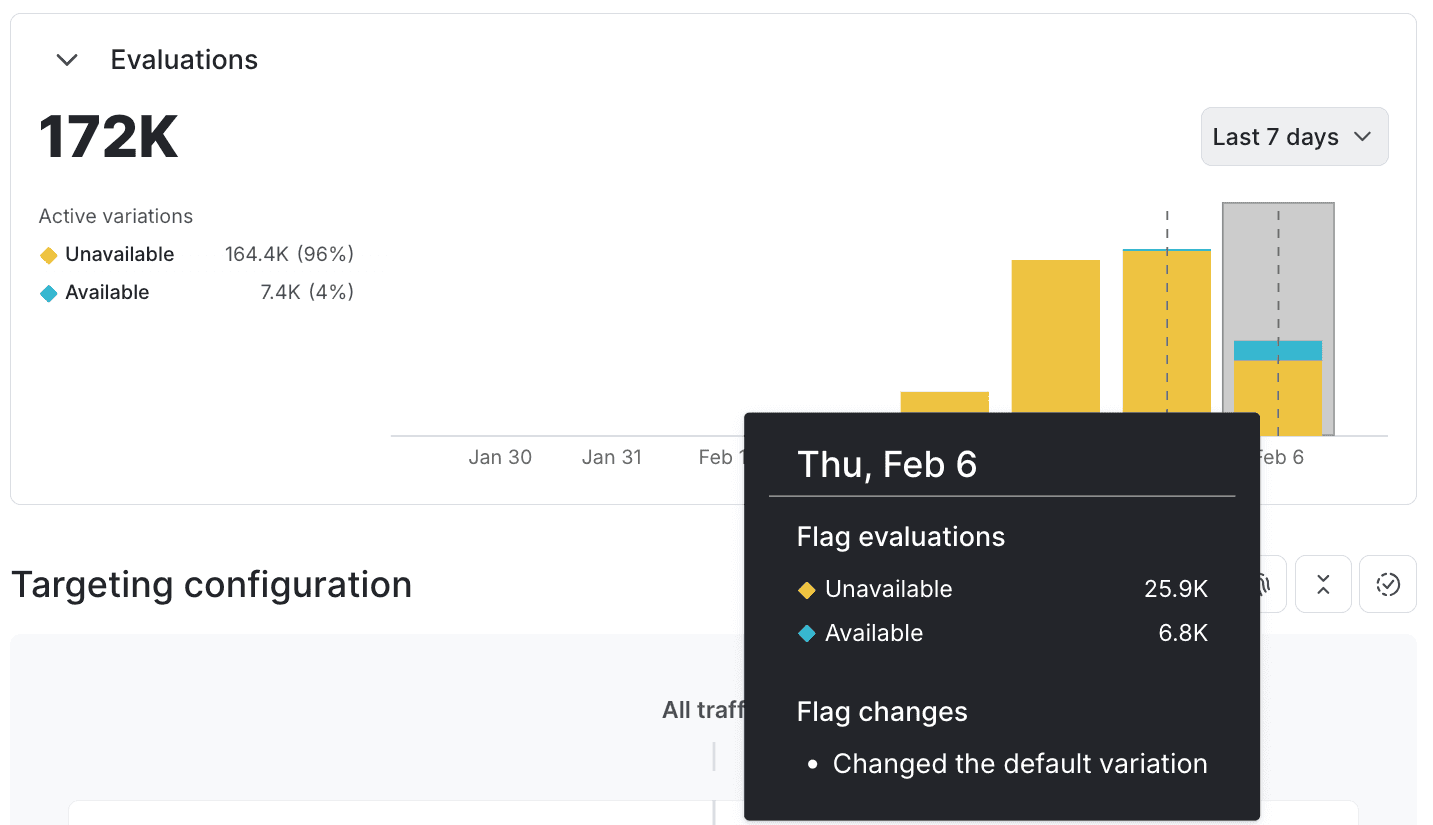
The default date range is the last seven days. To change the date range, click Last 7 days and select a new date range.
LaunchDarkly generates the flag evaluations graph based on analytics events, which are sent from variation calls from the LaunchDarkly SDKs. To learn more, read Evaluating flags.
Other SDK methods, such as getting all flags, typically do not populate the flag evaluations graph. To learn more and review the exceptions to this, read About the all flags feature.
Evaluation display
LaunchDarkly generates the flag evaluations graph on a per-flag evaluation basis, not a per-context instance basis. This means that if the same context instance is evaluated 20 times, the flag evaluations graph records and displays all 20 evaluations. New evaluations appear on the flag evaluations graph within one to two minutes.