Historical results for frequentist experiments
Read time: 1 minute
Last edited: Feb 08, 2025
Overview
This topic explains how to read and use the Historical results tab of a frequentist experiment.
The Historical results tab lets you see a variation's performance over time. You can view a variation's Relative difference from Control and its Conversion rate or Mean.
Relative difference from Control
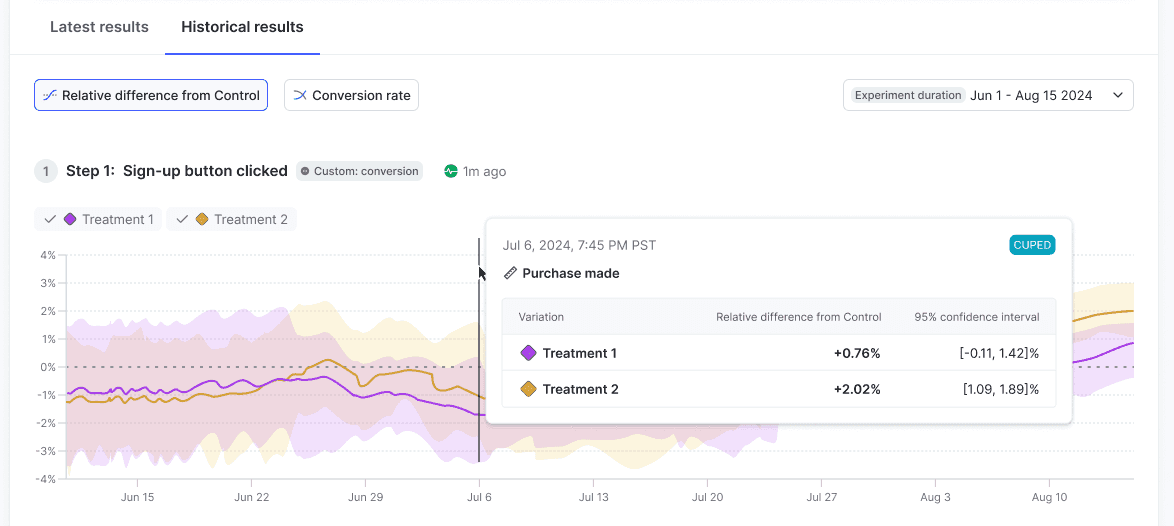
Click Relative difference from Control to view flag variation relative differences from the control over time.
The relative difference from the control variation measures how much a metric in the treatment variation differs from the control variation, expressed as a proportion of the control’s estimated value. Hover on any point of the chart to view the relative difference from control and 95% credible interval for each variation tested.
Conversion rate
Click Conversion rate to view flag variation conversion rates over time.
The conversion rate is:
- for binary metrics, the percentage of contexts that triggered at least one conversion event
- for count metrics, the total number of times a context triggered a conversion
The conversion rate displays for conversion metrics only.
Mean
Click Mean to view flag variation means over time. The mean is a variation's average numeric value that you should expect based on the data collected so far.
The mean displays for numeric metrics only.