Credible interval history
Read time: 2 minutes
Last edited: Oct 14, 2024
Overview
This topic explains how to read and use the credible interval history tab of an experiment.
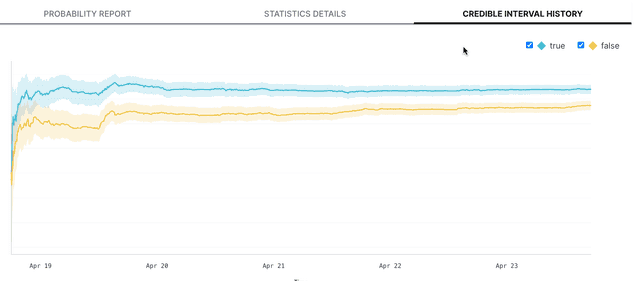
A metric's "credible interval" is the range that contains 90% of the metric's probable values for each variation. The credible interval history tab displays a visualization the metric's results over time. The solid line represents the point estimate of the metric, which is the estimated mean of the metric values for the variation. The larger shaded area represents the the credible interval.
When to ship winning variations
Early experiment results tend to be "noisy," with a large credible interval, because the metric hasn't yet collected enough data to determine a clear winner. As the experiment continues to run, its results will stabilize over time. The longer the experiment runs, the narrower and more precise the credible interval should become and the more confidence you can have in the results of the experiment.
Viewing an experiments's credible interval history helps you determine when the experiment has run long enough to make a decision about the winning variation:
- If the credible interval is continuing to narrow, you may want to continue to let the experiment run so its results become more precise.
- If the credible interval has stabilized, it's likely that you have gathered all of the data you need to select a winning variation and stop the experiment.
In this example, the credible interval began to stabilize around April 20th, and the experiment has now collected enough data for you to ship the winning variation:
